The Trends
As you can see from Diagram 1, during a long period of time, Skechers bounced up and down on expectations and uncertainties about future revenue and net profit growth. Finally, on July 22, 2016, the stock plunged below $25 per share because the company missed the expectations.
Despite that, I would like to look at the situation from a different angle and focus on the results themselves. In my opinion, there are five main reasons why Skechers' results look better than most investors think:
1. In Q2, the top line has increased by more than $77M year-over-year, or by ~10%. The six-month sales, as a result, have increased by more than 18%.
2. The Q2 net income has decreased by ~7% YoY, while the six-month net profit is still impressively 26% higher than a year before.
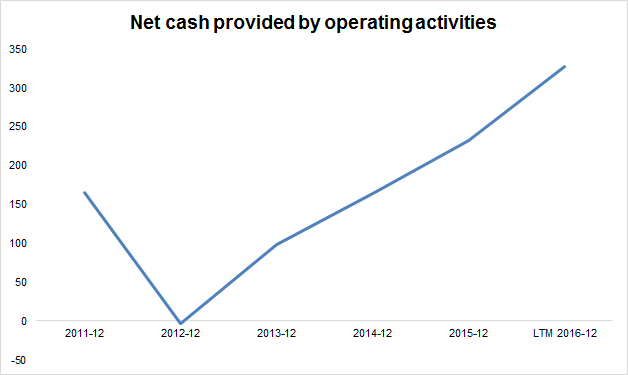
3. The cash flow from operating activities has been rising for more than four years! In this year, the figure has increased by more than 41%.
4. The margins are good. They have been increasing for almost six years. The net profit margin of 7.8% is surely lower than Nike's (NYSE:NKE) 11.6% or the industry's average of 8.9% but is still quite high and growing. Moreover, even with such margins the company shows great net profit growth, which is one of the highest in the industry (see Diagrams 3, 4).
5. The working capital management during this year has been efficient. The last-twelve-months' cash conversion cycle has decreased to 108 days from 116 days at the end of FY2015. Moreover, the main driver of this contraction is the decrease in inventory turnover by more than 16 days, or by 12%+.
Diagram 2.